Use Statistical Charts
This tutorial guides you through tracking API Calls, WSS Notifications, and RPC Calls, and provides insights into network and method breakdowns to effectively monitor your blockchain projects.
Prerequisites
- A compatible wallet for the blockchain network installed on your device, such as MetaMask browser extension or any wallet supporting the Wallet Connect protocol on your phone or laptop.
- Login already performed on Consumer APP
- Project already created as mentioned in this section
Introduction:
Statistical charts offers a comprehensive overview of the activity on the Blast app. Within the API Calls tab, metrics like Total API Calls, WSS Notifications and RPC Calls can be tracked to assess usage intensity. The Chains Breakdown and Methods Breakdown tabs empower users to analyze networks or methods, with flexible date selection and filtering supporting data analysis across different time intervals: 24 hours, 7 days, 30 days or any specific period no longer than 30 days.
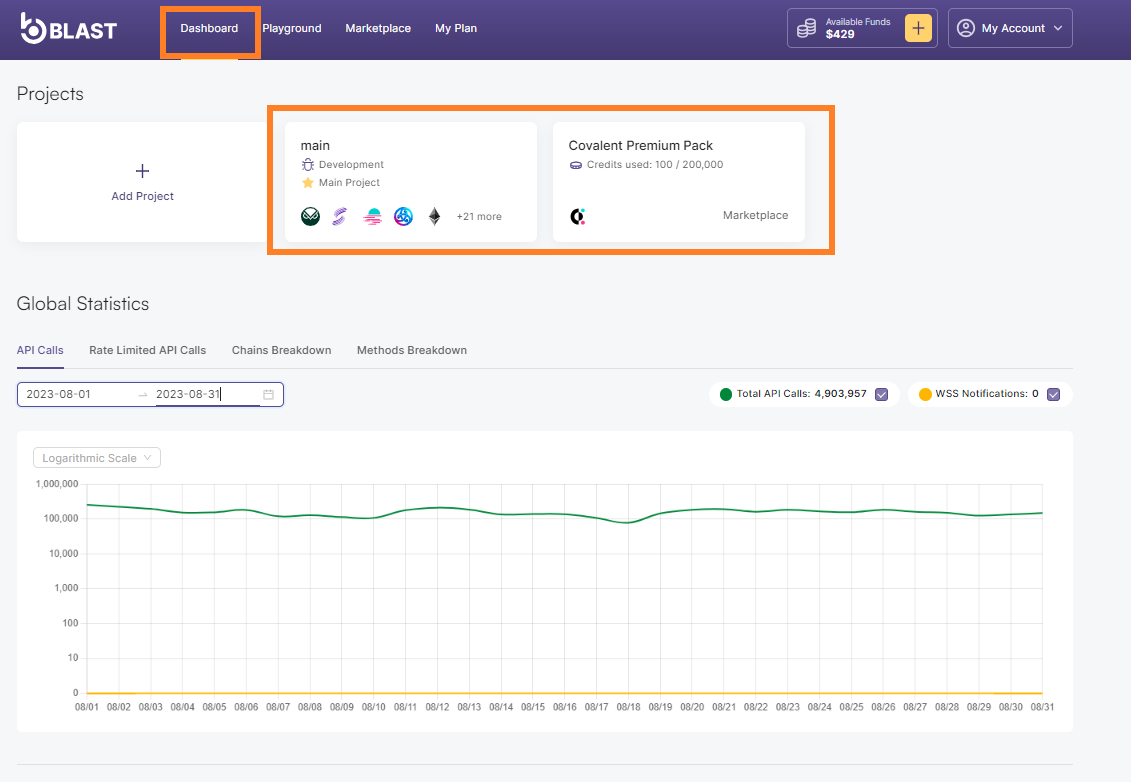
How to use Global and Project charts:
- There are three types of charts available for users to explore: Global statistics on the Dashboard, dedicated statistics for each project, or specific statistics for individual endpoints. You can visit the Dashboard page to access global statistics for your account, choose a specific project for dedicated charts or navigate to an active endpoint to view focused charts tailored to that specific one. In all Statistics tabs we have the possibility to hide/show in the chart the metrics by clicking the checkboxes/closeButton after the name of the metric, and also the possibility to change the Y scale from logarithmic to linear and vice versa (to better see the inflections of the graphs in some cases).
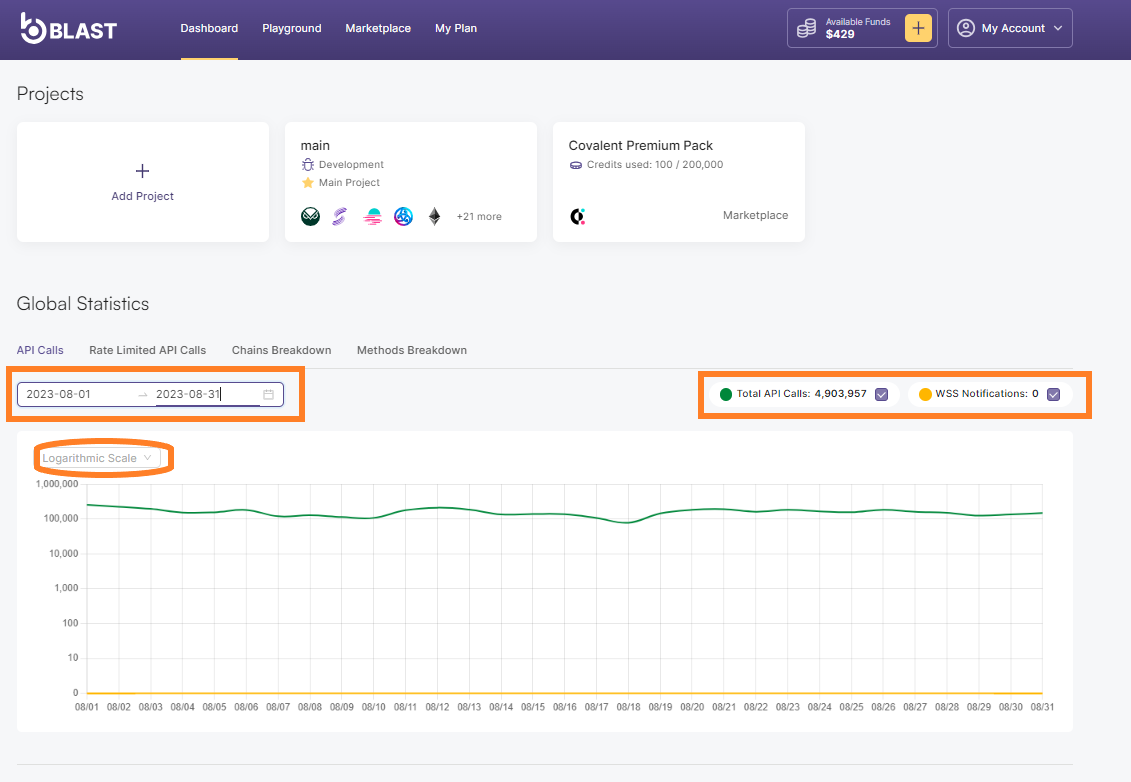
- On the API Calls tab, you can observe key metrics such as Total API Calls, WSS Notifications gaining insights into how actively the platform is being used. You can also take advantage of the flexible date selection and filtering options available to analyze data across various time intervals, including 24 hours, 7 days, 30 days, or specific custom periods not exceeding 30 days. This helps to accurately identify trends and evaluate usage patterns more effectively.
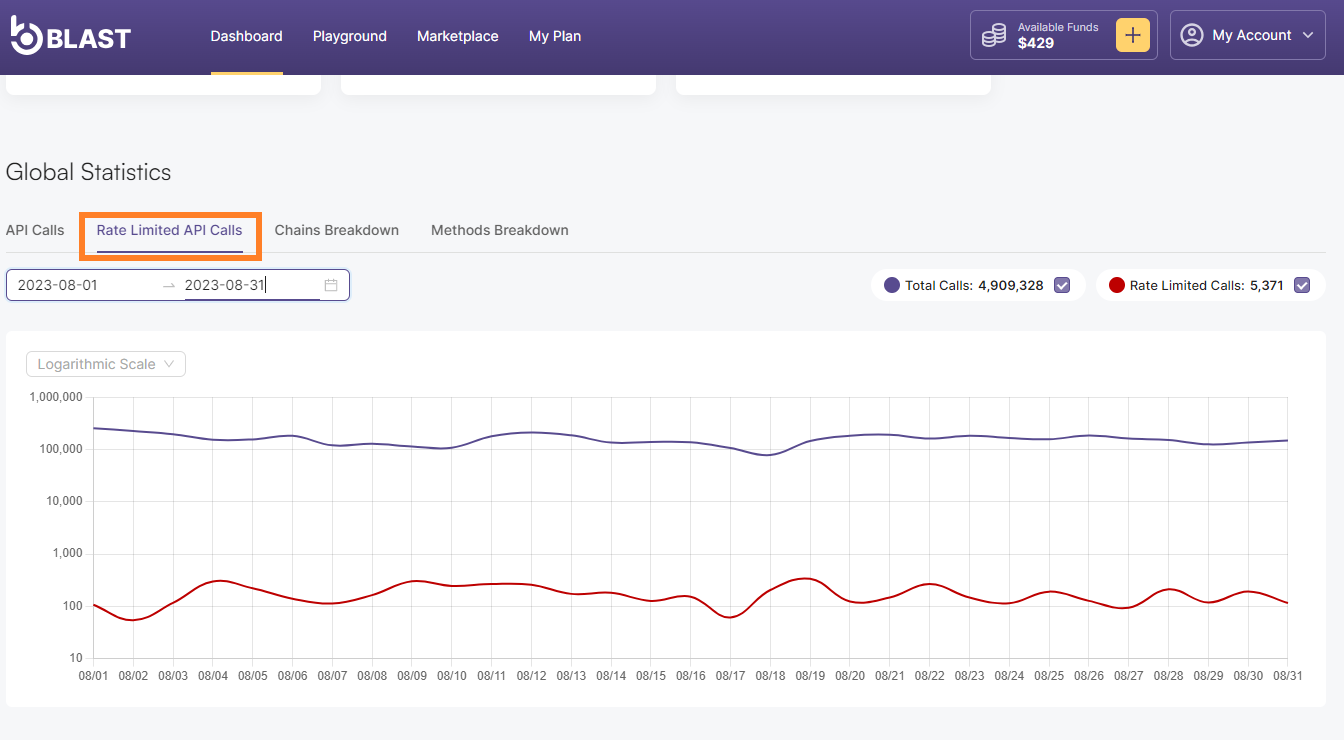
- Click on Rate Limited API Calls tab to check the Total API Calls and how many sent calls were forbidden to be executed with rate limit reached reason.
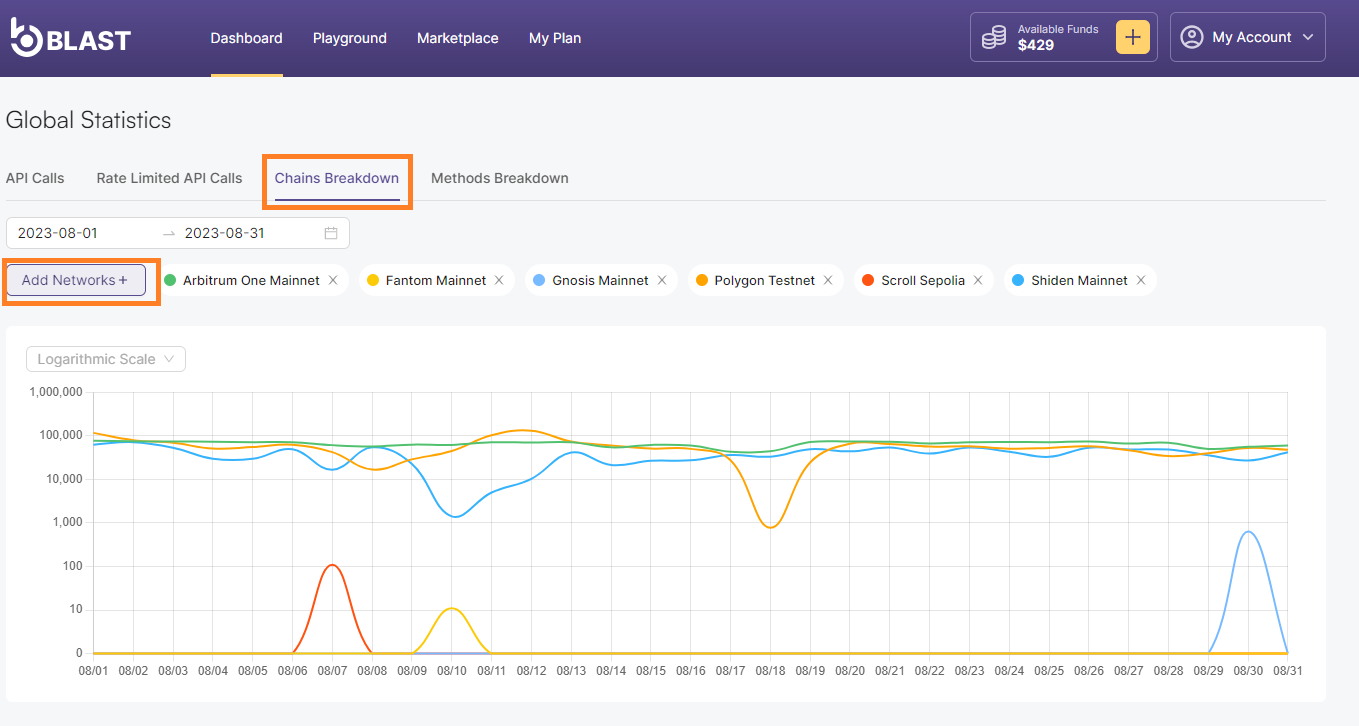
- Click on the Chains Breakdown tab to explore a detailed breakdown of the various networks contributing to the activity. Network selection becomes available when you click on the Add Networks button.
- The Methods Breakdown tab empowers you to analyze specific methods within the selected networks to gain a deeper understanding of the usage trends. On the right side of the chart you can also take a look n the Top 10 Most Used Methods.
